Performing Analysis of Meteorological Data
Performing Analysis of Meteorological Data
Objective:
The main objective is to perform data cleaning, perform analysis for testing the Influences of Global Warming on temperature and humidity, and finally put forth a conclusion.
Given Hypothesis:
The Null Hypothesis H0 is “Has the Apparent temperature and humidity compared monthly across 10 years of the data indicate an increase due to Global warming”
The H0 means we need to find whether the average Apparent temperature for the month of a month says April starting from 2006 to 2016 and the average humidity for the same period has increased or not.
Dataset:
The dataset can be obtained from Kaggle. The dataset has hourly temperature recorded for the last 10 years starting from 2006–04–01 00:00:00.000 +0200 to 2016–09–09 23:00:00.000 +0200. It corresponds to Finland, a country in Northern Europe.
Source URL: https://www.kaggle.com/muthuj7/weather-dataset
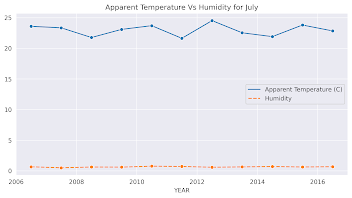
Function for plotting Humidity & Apparent Temperature for each month
The above graphs show many ups and downs in the temperature and the average humidity has remained constant throughout the 10 years.
Conclusion:
From this analysis, we can conclude that the Apparent temperature and humidity compared monthly across 10 years of the data indicate an increase due to Global warming.
Source code: GitHub
I am thankful to mentors at https://internship.suvenconsultants.com for providing awesome problem statements and giving many of us a Coding Internship Experience. Thank you www.suvenconsultants.com


Comments
Post a Comment